When does the DCA smile curve turn a losing plan into a profit?
Buying more units while the price falls: how far can that actually pull your average cost down? And why does it budge less and less the longer you keep going? Below, the numbers are worked out one period at a time.
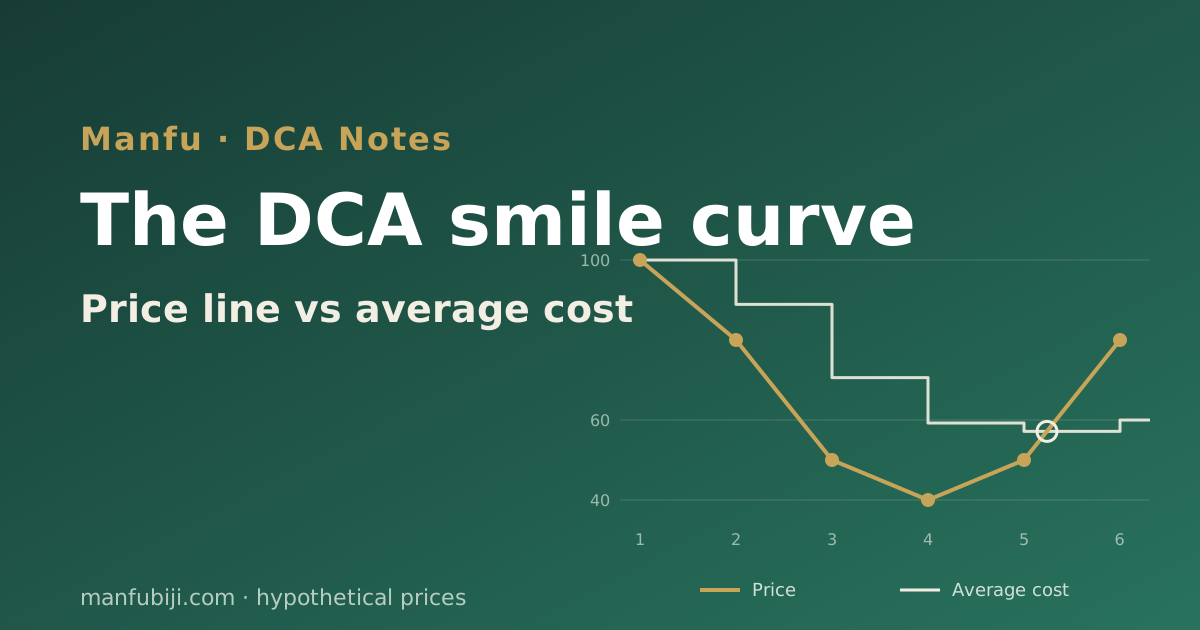
The DCA smile curve describes a stretch like this: the price falls first, then climbs back, and your account goes from a paper loss to a paper gain along the way, tracing a U on the chart. The account turns from loss to profit once the price gets back above your average cost; it doesn't have to climb all the way back to your first purchase price. In the hypothetical prices below, the first buy is at 100, and by the time the price is back at 80 the account is already up 33.33%.
Average cost = total invested ÷ total units bought. With a fixed amount each period, the low-priced periods buy more for the same money, so the average cost can never sit above the simple average of the prices. Leaving fees aside, this average-cost line is your break-even line; add buying and selling fees and it shifts up a little.
The smile curve in plain terms
The idea behind the smile curve comes down to two sentences: in the periods when the price falls, the same money buys more units; once the price recovers, all those cheap units rise together.
For bitcoin the mechanism is the same: a fixed amount goes in each period, the price changes, and the number of units you get changes with it, whether you're buying a fund or a coin. What has to be looked at separately is the precondition, and a later section covers the cases where the curve never shows up. How to start a plan in the first place, and how to set the amount and the interval, is laid out step by step in The Complete Bitcoin DCA Guide: from zero to your first buy; everything below stays on a single number, the average cost.
Average cost, period by period, at 1,000 per buy
The six prices below are made up to keep the bookkeeping simple and have nothing to do with any real market; every step can be checked with a calculator. Each period invests 1,000, fees are left out for now, and the average cost is rounded to two decimal places.
| Period | Price | Units bought | Total invested | Total units | Average cost after the buy |
|---|---|---|---|---|---|
| 1 | 100 | 10 | 1,000 | 10 | 100.00 |
| 2 | 80 | 12.5 | 2,000 | 22.5 | 88.89 |
| 3 | 50 | 20 | 3,000 | 42.5 | 70.59 |
| 4 | 40 | 25 | 4,000 | 67.5 | 59.26 |
| 5 | 50 | 20 | 5,000 | 87.5 | 57.14 |
| 6 | 80 | 12.5 | 6,000 | 100 | 60.00 |
In the two periods when the price dropped from 80 to 50 and then to 40, you bought 45 units in total, twice the 22.5 units from the first two periods. Over those two periods the average cost fell from 88.89 to 59.26, a drop of 29.63.
After six periods the average cost is exactly 60. The simple average of the six prices is 400 ÷ 6 ≈ 66.67, which is 6.67 higher. That gap comes from investing a fixed amount each time: at low prices the same 1,000 buys more units, so the low prices carry more weight in the average.
Put mathematically, the average cost of fixed-amount DCA equals the harmonic mean of the prices: add up the reciprocals of the six prices, 0.01 + 0.0125 + 0.02 + 0.025 + 0.02 + 0.0125 = 0.1, then divide the number of periods by that sum, 6 ÷ 0.1 = 60. The harmonic mean is never higher than the simple average, and the two are equal only when every price is identical. As long as the price moves at all, the average cost of fixed-amount DCA stays below the simple average.
At what price does a bitcoin DCA plan break even?
Value the account at each period's price right after buying, and the same set of numbers looks like this:
| Period | Price | Holding value | Total invested | Paper gain/loss |
|---|---|---|---|---|
| 1 | 100 | 1,000 | 1,000 | 0 |
| 2 | 80 | 1,800 | 2,000 | −10.00% |
| 3 | 50 | 2,125 | 3,000 | −29.17% |
| 4 | 40 | 2,700 | 4,000 | −32.50% |
| 5 | 50 | 4,375 | 5,000 | −12.50% |
| 6 | 80 | 8,000 | 6,000 | +33.33% |
Holding value = total units × that period's price. After the fifth buy you hold 87.5 units, have spent 5,000, and your average cost is 57.14. On the way from 50 up to 80, the moment the price passes 5,000 ÷ 87.5 ≈ 57.14, the holding is worth more than 5,000 and the paper loss becomes a paper gain; that's where the right-hand side of the smile starts to curl up. After the sixth buy at 80, the average cost is lifted to 60, and the price is still 20 above it.
80 is 20% below the first buy at 100, yet the account is up 33.33%. Your first purchase price has no special standing when it comes to breaking even. It's just one of six prices, and the one at which you bought the fewest units.
How much do fees push the break-even line up?
Assume a fee rate of 1% here, deliberately on the high side so the difference is easy to see; it doesn't represent any platform's actual rate. That puts 10 of each 1,000 into fees, and the remaining 990 buys units; selling costs another 1% of the sale amount.
- Units actually bought over six periods: 990 ÷ 100 + 990 ÷ 80 + 990 ÷ 50 + 990 ÷ 40 + 990 ÷ 50 + 990 ÷ 80 = 9.9 + 12.375 + 19.8 + 24.75 + 19.8 + 12.375 = 99 units.
- Average cost including buying fees: 6,000 ÷ 99 ≈ 60.61.
- After the selling fee, for the proceeds to come to at least 6,000: 99 × price × 0.99 ≥ 6,000, so price ≥ 6,000 ÷ 98.01 ≈ 61.22.
Without fees the break-even line is 60; with 1% taken on both the buy and the sell, it becomes 61.22. To see what your own platform charges, check its fee page, then put the real rate into the same formula in place of the 1%.
The longer you DCA, the less one dip lowers your cost (DCA blunting)
Carry on from period 6. Suppose the price stays at 80 from period 7 through period 18, you keep investing 1,000 each time, and in period 19 the price drops to 40:
- Periods 7 to 18 make 12 periods: 12,000 invested, 12.5 units each time, 150 units in all.
- After period 18: 18,000 invested in total, 250 units in total, average cost 18,000 ÷ 250 = 72.00.
- Period 19 buys 25 units at 40: 19,000 invested in total, 275 units in total, average cost 19,000 ÷ 275 ≈ 69.09.
| The same 1,000 buy at 40 | Period 4 | Period 19 |
|---|---|---|
| Average cost before the buy | 70.59 | 72.00 |
| Average cost after the buy | 59.26 | 69.09 |
| Drop in average cost | 11.33 | 2.91 |
| This 1,000 as a share of total invested | 25% (1,000 ÷ 4,000) | about 5.26% (1,000 ÷ 19,000) |
Both buys are at the same price, and the average cost going in differs by only 1.41, yet period 4 lowered the cost by 11.33 while period 19 lowered it by just 2.91. The whole difference lies in the last row: as the total invested keeps growing, each new period makes up a smaller and smaller share of it. That is what DCA blunting refers to.
Framed another way, it's even clearer. After period 18, how many buys in a row at 40 would it take to bring the average cost from 72 back down to 60? Call it n: (18,000 + 1,000n) ÷ (250 + 25n) = 60. Multiplying out gives 18,000 + 1,000n = 15,000 + 1,500n, so n = 6. It takes six consecutive buys to move the cost by 12, whereas early in the plan, the single buy in period 4 moved it by 11.33.
Back on the smile curve: the longer the plan runs, the harder it is for a later dip or two to drag the break-even line down. Whether the account is up or down depends more and more on the cost of the large pile of units already bought, and a new period changes little.
Blunting sounds like bad news, but to me it has a reassuring side too: once a plan has been running for a while, whether any single period bought high or low makes little difference to the overall cost, so there's no need to agonize over every purchase. What it really breaks is the hope that one big crash later on will drag your cost right down. By period 19, a crash like that moves it by 2.91, the figure in the table above.
Cases where DCA never gets its smile
The right-hand side of the smile depends on the price getting back above your average cost. Without that part, however low DCA spreads your cost, the account is still at a loss.
The price keeps falling and never turns. Take another set of hypothetical prices: 100, 80, 50, 40, 25, 20, with 1,000 each period. Six periods buy 10 + 12.5 + 20 + 25 + 40 + 50 = 157.5 units, for an average cost of 6,000 ÷ 157.5 ≈ 38.10. At the last price of 20, the holding is worth 157.5 × 20 = 3,150, which is 47.5% less than you put in. The average cost can't go below the lowest price you've paid, so if every period sets a new low, the price stays under your average cost the whole way.
What you're buying goes to zero. At a price of 0 the holding is worth 0, however low you pushed the average cost.
You stop and sell at the bottom. The right half of the smile relies on units you still hold. Back to the first set of numbers: if you sold everything in period 4 at 40, the 67.5 units would bring back 2,700, locking the 4,000 you put in at a 1,300 loss, and the price returning to 80 later has nothing to do with that money any more. When the paper-loss stretch gets hard to sit through, My DCA is underwater — what now? helps you tell an account that's temporarily down from a method that has actually gone wrong.
You pause right through the cheap periods. The average cost gets pushed down in the low-price periods. Back to the first set of numbers: if you stopped after period 2 and kept what you held, you'd have 2,000 invested and 10 + 12.5 = 22.5 units, average cost = 2,000 ÷ 22.5 ≈ 88.89, and it stays there. When the price later gets back to 80, the holding is worth 22.5 × 80 = 1,800, still 200 down, or −10.00%, and it has to rise past 88.89 to break even. At the same price of 80, the account that bought all six periods is up 33.33%.
In the end, DCA only gets its smile if what you're buying rises over the long run. Whether that holds for bitcoin is your call to make; DCA itself won't bring the price back.
Investing on a schedule doesn't remove the risk of the asset you're buying, and it can't guarantee a return. Bitcoin's price swings sharply and you can lose all of your capital. Every price in this article is hypothetical and doesn't represent any real market or return.
Finding the break-even line in your own DCA records
For a plan where you've only bought and never sold, your platform's order history or your own spreadsheet is enough to find the break-even line:
- Add up the money actually taken out in each period, fees included, to get the total invested.
- Add up the units actually received in each period, using the figure after fees, to get the total units.
- Total invested ÷ total units is your average cost including buying fees.
- For the price at which selling leaves you no worse off, divide once more: total invested ÷ (total units × (1 − selling fee rate)).
Compare today's price with the figure from step 4: above it, your account has reached the right side of the smile; below it, you're still on the left half or at the bottom. If you've sold part of your holding along the way, there are several ways to allocate the cost of the units left, and the division above can't be applied as is.
The average cost equals the harmonic mean of the prices exactly only when every period's amount is the same and fees are ignored. For a plan where the amount varies, step 3 still holds, but the result is no longer that harmonic mean: the average cost leans toward the prices of the periods where you put in more.
Binance is not available in every country, including the US. Disclosure: if you enter this site's Binance invite code BN1516 when you register, Manfu may receive a referral fee, and you pay nothing extra. Investing carries risk; the content is for education only and is not investment advice.