Home › Notes › The ahr999 index
The ahr999 index: where the formula comes from, and how a DCA investor should use it
ahr999 is a ratio. It takes today's bitcoin price and measures it against two benchmarks at once — the average cost of anyone who has been buying daily for the past 200 days, and a fitted long-term growth curve. It can tell you roughly which band today sits in compared with the past years. It is not in the business of telling you to buy or to stop. This piece takes the formula apart, and gives just as much room to the things it gets wrong.
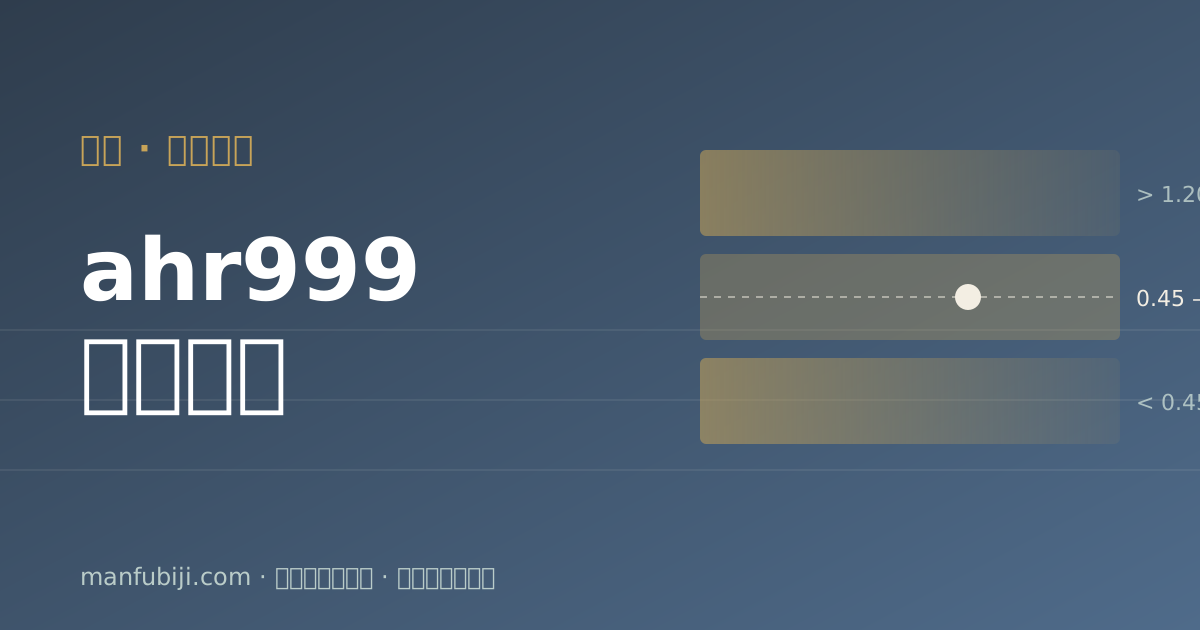
This piece deliberately does not tell you what the reading is today, or what it supposedly says about the market. The reason is simple: an article that teaches you how to read an indicator, and then nails one number into its own body text, turns into misinformation a few weeks later. So what follows is all mechanism — how the number is built, where the zone boundaries came from, and which parts of the world it never looks at. There is one screenshot further down that does show a set of figures, and it carries the month it was taken for exactly that reason. The live reading you can pull up in seconds on any public data site. The judgement stays with you.
What ahr999 actually is, and who made it
ahr999 is a bitcoin valuation ratio put forward by one individual. It is not an official metric published by any institution. The name of the indicator is simply that person's online handle; in the Chinese-language bitcoin community where it started, he is also known as Jiu Shen. Around 2018 to 2019 he published the algorithm, along with the long-term accumulation logic he ran alongside it.
Worth knowing if you are meeting it in English: this indicator grew up in a Chinese-language community, and most English write-ups are second-hand descriptions of that original post. It is part of why you keep finding the same three sentences repeated across a dozen sites, usually without anyone stopping to ask where the numbers in them came from.
What turned it into something people check daily was not academic validation. It was two very practical things. First, the algorithm is simple enough that anyone with public daily closing prices can recompute it from scratch — no paid data feed, no proprietary model, nothing you have to take on trust. Second, mainstream market-data sites folded it into their indicator libraries and update it automatically, which spared everyone the arithmetic.
Both points are worth holding on to, because together they define what kind of thing this is: its standing comes from how many people watch it, not from it having been rigorously proven. A widely watched indicator and a validated one are two different animals. That distinction gets heavy later, in the section on what it cannot see.
Taking the formula apart: two rulers multiplied together
The ahr999 value is the product of two ratios. Each measures one thing, and only together do they say anything complete:
| Component | What it measures | The question it answers |
|---|---|---|
| Price ÷ 200-day DCA cost | Today's price as a multiple of the average cost of daily DCA buyers over the past 200 days | Against that recent crowd of buyers, is today dear? |
| Price ÷ exponential growth valuation | Today's price as a multiple of a fitted long-term growth curve | Against the long-term growth path, is today dear? |
Start with the first ruler. The 200-day DCA cost is what you would have paid on average if you had bought a fixed amount every single day for the past 200 days. Its meaning is refreshingly literal: it is roughly the cost line of everyone who has been mechanically buying through the last six months or so. Divide today's price by it, and a result below 1 says the price sits under that crowd's average — buy now and you are getting in cheaper than they did. Clearly above 1 says that crowd is already sitting on a gain, and you would be stepping in above them.
This ruler tracks a DCA investor's lived experience closely. Its flaw is that it only ever sees 200 days. Through a year-long bull run the cost line gets dragged up the whole way, and the ratio can drift back towards 1 — which does not mean the price is cheap, only that it is not dear compared with the people who bought in the last six months.
The second ruler exists to patch exactly that short-sightedness. The exponential growth valuation fits a long-term curve against bitcoin's age — the number of days since it came into existence — and then reads off the value that curve puts on today. The assumption underneath is that bitcoin's long-run centre of gravity climbs roughly along a straight line on a logarithmic chart. Dividing the price by the curve's value measures how far the market has strayed from that path.
Multiply the two, and the meaning is this: the product only goes genuinely low when both benchmarks say cheap. Cheap against recent buyers but far above the long-term curve, and the product gets pulled back up; the reverse holds too. This is the cleverest part of the design — it is not easily fooled by cheapness in a single dimension.
The day I finally worked through the formula, what I liked about it was the honesty. It makes no pretence of predicting anything; it takes the woolly question of whether something is dear and splits it into two distances you can actually measure. Then it stops. What you do next, it does not presume to decide for you. The trouble is that almost everyone meets it in the opposite order — they start from what is it at today, and never work back to what is it measuring.
Where 0.45 and 1.2 came from
The most important sentence goes first: the numbers below are boundaries the original author drew in 2019, by backtesting the history he had at the time. They are not physical constants. As a reference scale they earn their keep. As buy and sell trigger lines they are a mistake.
| Reading | The author's name for it | How to read it |
|---|---|---|
| Below 0.45 | Bottom-fishing zone | The deeply undervalued stretch that turned up rarely in that backtest |
| 0.45 to 1.2 | DCA zone | Where the reading spends most of its life — buy to plan and get on with your day |
| Above 1.2 | Dear | The price is running well ahead of both benchmarks |
You might reasonably ask why 0.45 and not 0.5. The answer is unglamorous: both boundaries were drawn after the fact. The author took the history he could get hold of, looked at which readings had gone with a decent buying experience, and drew two lines. That is common practice in quantitative work, and it overfits easily — where the line lands depends on what your sample happens to look like, and a different sample can move it.
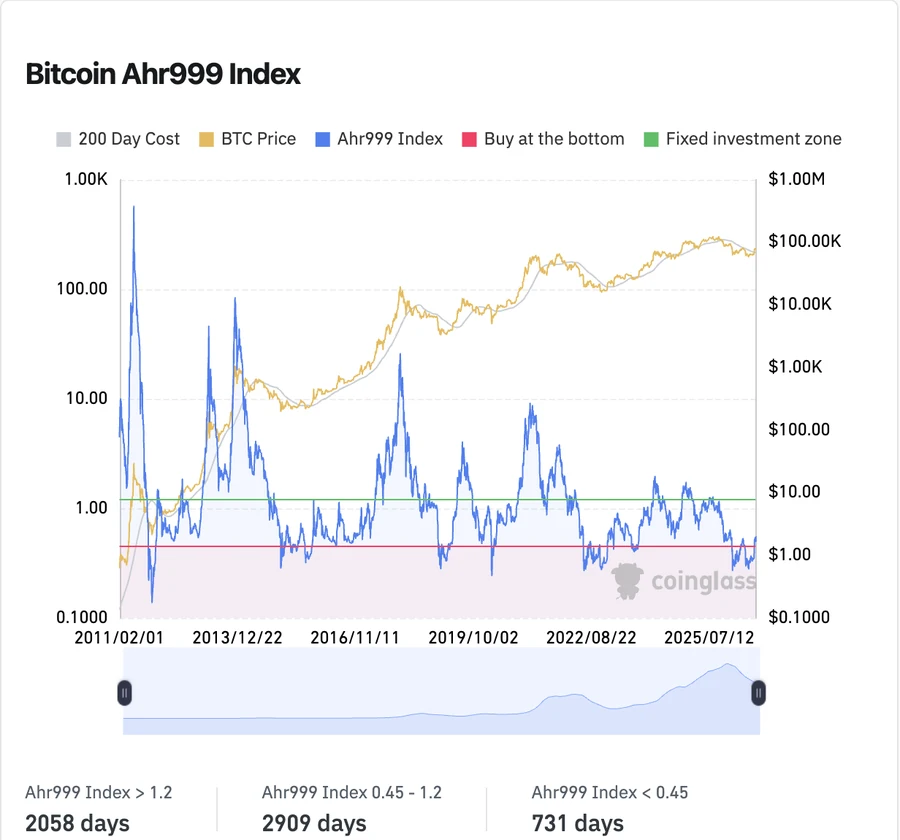
Now put those three day counts to work, because they say something the zone names do not. Add them up and the charted history runs to 5,698 days. On that basis the index has spent roughly 13% of its life below 0.45, about 51% inside the 0.45 to 1.2 band, and about 36% above 1.2. Two things follow. The bottom-fishing zone is rare — call it one day in eight, and those days do not arrive on a schedule you can plan around, so a strategy whose active ingredient is buying below 0.45 is a strategy that spends most of its life idle, waiting. And the dull middle band is the normal state of the world: more than half of all days sit in it. The author named it the DCA zone for a reason. For most of the days of your investing life, the honest answer this indicator gives you is carry on buying to plan.
One caveat travels with those percentages, and it is why I worked them out in front of you instead of quoting a round number: the denominator is alive. Those counts are what one provider's page showed on the day I took the screenshot. Every day that passes adds one to whichever bucket the market lands in, and a provider that refits its long-term curve can reshuffle the days sitting close to a boundary. So when you meet a bare claim that the index has been in the buy zone x per cent of the time, with no date and no source attached, treat it the way you would any statistic handed to you without its denominator.
While we are on that screenshot, it is worth walking the arithmetic through once, because a worked example makes the formula concrete in a way a definition never does. On the day I captured the page, the data table below the chart — not visible in the crop above, which stops at the day counts — listed an Ahr999 reading of 0.51684, a BTC price of $79,076 and a 200 Day Cost of 69,526.97. First ruler: 79,076 ÷ 69,526.97 comes out around 1.14, so the price stood roughly 14% above the average cost of anyone who had been buying daily through the preceding 200 days. Yet the index as a whole read 0.517, comfortably under 1. That only adds up if the second ruler is doing the heavy lifting: 0.517 ÷ 1.14 is about 0.45, meaning the price sat at something like 45% of what the fitted long-term curve put on that day. There is the multiplication doing its job — dear against the short-term benchmark, cheap against the long-term one, and the product landing inside the middle band. Take all three figures for what they are: a 2026-09 snapshot that has moved since, quoted here to show the arithmetic and nothing else. I am not telling you what any of them does next.
What it is genuinely good for: a reference frame that ignores your mood
So what is it actually for? My answer: the real value is not timing. It is having a reference frame that does not care how you feel.
The hard part of DCA was never the arithmetic; it is the sitting through. When the market has been falling for six months, every headline reads like a funeral, and the chat groups are a queue of people explaining why it is finished, the voice in your head starts saying this time is different, maybe pause for a while. What an indicator can offer is exactly what the headlines and the group chat cannot: a coordinate with no opinion about your mood — where today sits, measured against the last several years.
The point is not that it is accurate. The point is that it is steady. It runs the same arithmetic against the same two benchmarks every day, and it does not change its mind because someone with a large following posted. Glance at it mid-panic, find the reading still sitting in the middle band, and at the very least it reminds you that what is hurting is the speed of the fall rather than the level the price has reached. It works the other way round too: when everyone is shouting about getting on board and the reading is plainly a long way ahead of both benchmarks, one look may be enough to keep your hand still.
Put it another way — what it treats is the I reckon, not the should I buy. The first of those jobs is badly underrated. The second, the one it keeps being asked to do, is badly overrated.
And if the part you struggle with is the sitting through itself rather than the reading, an indicator is the wrong medicine entirely; I wrote about that separately in can't stick with DCA? make it a habit, not willpower. The fix there is structural, not informational.
Four things it cannot account for
This is the section I most want you to finish. Most pages about ahr999 stop at how to read the three zones — but what actually decides whether this thing hurts you is the four things below, none of which it ever took into account.
One: the fitted benchmark drifts
The second ruler is fitted to historical exponential growth, and buried inside it is a premise: that future growth runs at roughly the rate past growth did. But bitcoin's market capitalisation keeps getting larger, and for anything that size, growth slowing is the ordinary case rather than a surprise. If the real growth rate comes in under the slope of that curve, the curve keeps putting too high a value on today, and the ratio runs systematically low — which looks like a long stretch of being undervalued, when it may just be a benchmark going stale. Benchmark drift sets off no alarm. It simply makes the indicator look cheaper and cheaper.
Two: it knows the price, not the world
The formula takes exactly one input: the price series. Which means macro liquidity, shifts in how different jurisdictions regulate the asset, structural arrivals like spot ETFs — it knows nothing about any of them. Those things change the channels money arrives through and the mix of people taking part, which is to say they change how the price gets formed in the first place. A benchmark fitted purely from past prices has no way of recording that the rules of the game were rewritten.
Three: different data sources give different readings
It looks like one indicator, but the number you get depends on who computed it. The differences come from small places: which trading pair the price is taken from, how the daily price is fixed, which stretch of history the curve is fitted over, how the 200 days are aligned. In the middle of the band none of that matters. When the reading is sitting right on top of 0.45 or 1.2, and site A says it has entered the bottom-fishing zone while site B says not yet, it matters enormously. If your action depends on a reading crossing a line, what you are really depending on is one provider's methodology.
Four: use it to time and your DCA degrades into discretion
This one is the most hidden and the most expensive. DCA works for ordinary people precisely because it is dumb: fixed amount, fixed date, no looking at the price, no room for a decision. The moment you bolt on double up below this reading, pause above that one, you have invited the decisions back in — and every decision point is a door your emotions can walk through. I went through this trap in is smart DCA (buy more on dips) worth it?: rules-based topping up is not wrong in itself, but people badly underestimate how hard it is to actually place the order at the exact moment you most ought to. Using ahr999 as a switch puts you in front of the same difficulty, with one more layer of uncertainty stacked on top — whether the indicator itself still holds.
ahr999 gives you a sense of where you are standing. The price of that is a benchmark that drifts with time, an input that sees nothing but price, and a pair of boundaries drawn after the fact. Used as a reference frame, those costs are affordable. Used as a buy and sell switch, they all come due together, on the one occasion you most needed it to be right.
How to fit it into your own DCA
Three boundaries, all of them unexciting, and all of them how I use it myself.
One: file it under observation, never under execution. Set the DCA plan the way you would have set it anyway — fixed amount, fixed date, automatic. Whether you look at the indicator this month has no bearing on whether the buy goes through. What you can usefully do is write one line of notes beside the reading each month: where it sat, and how you felt at the time. Read those notes back six months later and they will be worth a good deal more to you than the readings ever were.
Two: do not turn the zone boundaries into triggers. If you really want your contribution to move with valuation, at least let it move continuously, rather than doubling the instant 0.45 is crossed. The day a reading crosses a line that was drawn after the fact and the day before it are not different in any fundamental way. The thing that changed is your psychology.
Three: if you want to know whether adjusting by the indicator is actually better, take neither my word nor its word — go and test it. This is entirely quantifiable: one stretch of history, flat fixed-amount DCA on one side, valuation-adjusted amounts on the other, then compare average cost and final value. Our own DCA backtest tool exists for exactly this, and you can move the date range around as much as you like. One trap to avoid: any adjustment rule will look wonderful if you tune its parameters and measure its performance on the same slice of history, because you are using the answer to build the answer. For a real test, fix the parameters on the first half and check them on the second.
One common confusion is worth clearing up while we are here. ahr999 and the halving cycle are not the same kind of object, and using either to corroborate the other proves nothing. The halving's date is fixed in the protocol and can be worked out years ahead; ahr999 is a valuation ratio derived from price, with no schedule anywhere inside it. On how cycle awareness should and should not feed into a DCA plan, see DCA meets the bitcoin halving; if you only want to see how far the current cycle has run, we keep a halving cycle tracker.
An indicator is a tool for understanding, not a licence to time
Compress the whole piece into one line: ahr999 is a tool for understanding where you are standing. It is not a licence to time the market.
I understand why it appeals. The most uncomfortable thing about DCA is that once the money has gone in you have no idea where you are standing — it rises and you cannot tell whether to carry on, it falls and you cannot tell how far down goes. A number that will say roughly whether today counts as cheap or dear naturally relieves that weightlessness. The need behind it is real, and ahr999 does partly meet it.
But between I know where I am standing and I should therefore adjust my position lies a very wide ditch. Crossing it takes more than an indicator. It takes a whole set of rules you have tested and can actually follow, plus the discipline to follow them in panic and in greed alike. Very few people — me included — would claim to have all of that reliably. Nearly every one of the 5 common DCA mistakes begins with somebody believing they have got hold of a signal everyone else has missed.
So my advice is dull, and I think it is right: treat ahr999 as a thermometer, not a steering wheel. Take a look, note which band you are in, then go back to executing that clumsy plan that asks no judgement of you. Indicators stop working, benchmarks drift, providers disagree with one another — and a DCA plan that has run for years without a break needs not one of those things to hold true. That is what getting wealthy slowly actually looks like from the inside: fewer decisions, made better, and time doing the rest of the work. If you want the foundations laid first, start with the complete bitcoin DCA guide, which covers what it is, why, how much, how long and how to set it up, all in one go.
Get the plan that needs no judgement running first
Watching an indicator is a bonus. The foundation is an account that buys on schedule without asking your opinion every month. Get the DCA running first; the reference frame can come afterwards.
Disclosure: if you enter this site's Binance invite code BN1516 when you register, Manfu may receive a referral fee, and you pay nothing extra. Investing carries risk; the content is for education only and is not investment advice.
FAQ
Who came up with the ahr999 index?
It came from an individual bitcoin holder in the Chinese-language crypto community, and the indicator carries his online handle; that community also knows him as Jiu Shen. He published the algorithm, together with his own long-term accumulation logic, somewhere around 2018 to 2019. It is a private, community-born metric with no institutional backing. Market-data sites later added it to their indicator libraries and have kept computing it daily ever since, which is how it grew into something a lot of people check every morning.
Where do I look up the current ahr999 reading?
Not here — this site does not publish a live reading. Public market-data sites do: CoinGlass keeps a daily Bitcoin Ahr999 Index page that shows the reading alongside the BTC price and the 200 Day Cost, so you can see all three at once, and a handful of other data sites carry the same indicator. Each provider builds it from slightly different inputs, so small differences after the decimal point between one site and another are normal rather than a sign that someone is wrong.
Does a reading under 0.45 mean it is time to go all in?
No. 0.45 is a line the author drew in 2019 from the history available to him then, and it describes a past distribution rather than a future guarantee. The more practical objection is that going all in and DCA are mutually exclusive by definition: if one reading makes you fire every bullet you have, you have nothing left to buy with when the price falls further. A low reading at most says today looks cheap against two benchmarks. It cannot tell you whether tomorrow will be cheaper.
Is ahr999 the same thing as the bitcoin halving cycle?
No. The halving is a supply event written into the protocol, and its date can be worked out years in advance. ahr999 is a valuation ratio produced by comparing today's price with two benchmarks, so it only describes how far the price sits from them right now and carries no schedule of any kind. The two can look as though they rhyme on a chart, but that is two ways of recording the same stretch of history, not one deriving the other.